Besighede in Pasuruan
Industries
Besigheidsverspreiding volgens industrie Inkopies: 27,7%
Restaurante: 16,9%
Voedsel: 8,5%
Opvoeding: 7,6%
Godsdiens: 6,5%
bedryf: 5,5%
Ander: 27,3%
| Bedryfsbeskrywing | Aantal inrigtings | Gemiddelde Google-gradering | Besighede per 1 000 inwoners |
|---|---|---|---|
| Motorwerktuigkundige | 236 | 4.1 | 0.3 |
| Publieke administrasie | 276 | 3.9 | 0.3 |
| Ander opvoeding | 278 | 4.4 | 0.3 |
| Hoër onderrig (colleges en universiteite) | 213 | 4.5 | 0.2 |
| Primêre skool en créche | 408 | 4.2 | 0.4 |
| Sekondêre onderrig | 215 | 4.4 | 0.2 |
| Banke | 369 | 4.2 | 0.4 |
| Leningsmaatskappye | 511 | 4.3 | 0.6 |
| Kruidenierswinkels en supermarkte | 569 | 4.0 | 0.6 |
| Algemene Kontrakteurs | 230 | 4.1 | 0.3 |
| Ander akkomodasie | 208 | 4.2 | 0.2 |
| Gesondheid en medies | 243 | 3.9 | 0.3 |
| Moskees | 728 | 4.4 | 0.8 |
| Indonesiese restaurante | 404 | 4.1 | 0.4 |
| Kafees | 408 | 4.1 | 0.4 |
| Elektronika winkels | 191 | 4.2 | 0.2 |
| Hardewarewinkels | 231 | 4.0 | 0.3 |
| Kantoorvoorrade en skryfbehoeftewinkels | 252 | 4.5 | 0.3 |
| Oppervlak van Pasuruan, Jawa Timur | 147 km² |
| Bevolking | 919573 |
| Manlike bevolking | 455891 (49,6%) |
| Vroulike bevolking | 463684 (50,4%) |
| Bevolkingsverandering vanaf 1975 tot 2015 | +76,9% |
| Bevolkingsverandering vanaf 2000 tot 2015 | +12,9% |
| Gemiddelde ouderdom | 28,9 |
| Gemiddelde ouderdom van mans | 28,3 |
| Gemiddelde Ouderdom, Vrouens | 29,5 |
| Area Kodes | 34, 343 |
| Lokaaltyd | Vrydag 09:02 |
| Tydsone | Wes-Indonesië-tyd |
| Lengte & Breedtegraad | -7.6453° / 112.9075° |
| Poskodes | 66214, 67111, 67112, 67113, 67114, Meer |
Kaart - Pasuruan, Jawa Timur
Bevolking Pasuruan, Jawa Timur
Jaar 1975 tot 2015| data | 1975 | 1990 | 2000 | 2015 |
|---|---|---|---|---|
| Bevolking | 519766 | 712261 | 814601 | 919573 |
| Bevolkingsdigtheid | 3535 / km² | 4845 / km² | 5541 / km² | 6255 / km² |
Bevolkingswisseling vanaf 2000 tot 2015 Pasuruan
Verhoging van12,9% vanaf jaar2000 tot 2015| Plek | Verandering sedert 1975 | Verandering sedert 1990 | Verandering sedert 2000 |
|---|---|---|---|
| Pasuruan, Jawa Timur | +76,9% | +29,1% | +12,9% |
| Jawa Timur | +52,7% | +17,9% | +7,5% |
| Indonesië | +96,9% | +41,9% | +21,7% |
Gemiddelde ouderdom Pasuruan, Jawa Timur
Gemiddelde ouderdom: 28,9 jaar| Plek | Gemiddelde ouderdom | Mediaan ouderdom (vroulik) | Mediaan ouderdom (manlik) |
|---|---|---|---|
| Pasuruan, Jawa Timur | 28,9 jaar | 29,5 jaar | 28,3 jaar |
| Jawa Timur | 31 jaar | 31,7 jaar | 30,3 jaar |
| Indonesië | 27,2 jaar | 27,5 jaar | 26,9 jaar |
Pasuruan, Jawa Timur Bevolkingsboom
Bevolking volgens ouderdom en geslag| ouderdom | Manlik | Vroulik | totale |
|---|---|---|---|
| Onder 5 | 38787 | 37103 | 75890 |
| 5-9 | 41555 | 38620 | 80175 |
| 10-14 | 42444 | 39880 | 82324 |
| 15-19 | 40500 | 40281 | 80781 |
| 20-24 | 37397 | 38005 | 75403 |
| 25-29 | 41548 | 42400 | 83948 |
| 30-34 | 38177 | 40055 | 78232 |
| 35-39 | 37298 | 38560 | 75858 |
| 40-44 | 34847 | 36758 | 71606 |
| 45-49 | 30504 | 31814 | 62319 |
| 50-54 | 25491 | 24603 | 50095 |
| 55-59 | 18616 | 16753 | 35369 |
| 60-64 | 11020 | 12736 | 23757 |
| 65-69 | 8018 | 9921 | 17940 |
| 70-74 | 4975 | 7951 | 12926 |
| 75-79 | 2687 | 4553 | 7240 |
| 80-84 | 1326 | 2436 | 3762 |
| 85 Plus | 702 | 1255 | 1957 |
Bevolkingsdigtheid Pasuruan, Jawa Timur
Bevolkingsdigtheid: 6255 / km²| Plek | Bevolking | gebied | Bevolkingsdigtheid |
|---|---|---|---|
| Pasuruan, Jawa Timur | 919573 | 147 km² | 6255 / km² |
| Jawa Timur | 38.2 miljoen | 47 774,1 km² | 800.1 / km² |
| Indonesië | 252.8 miljoen | 1 893 657,8 km² | 133.5 / km² |
Geskiedkundige en Geprojekteerde Bevolking Pasuruan, Jawa Timur
Geskatte bevolking vanaf 1400 tot 2100Sources:
1. JRC (European Commission's Joint Research Centre) work on the GHS built-up grid
2. CIESIN (Center for International Earth Science Information Network)
3. [skakel] Klein Goldewijk, K., Beusen, A., Doelman, J., and Stehfest, E.: Anthropogenic land use estimates for the Holocene – HYDE 3.2, Earth Syst. Sci. Data, 9, 927–953, https://doi.org/10.5194/essd-9-927-2017, 2017.
Area kodes
Persentasie Areakodes wat deur besighede gebruik word in Pasuruan Area Kode 8: 56,3%
Area Kode 34: 41,2%
Ander: 2,5%
Besigheidsverspreiding per prys vir Pasuruan, Jawa Timur
matige: 77,4%
goedkoop: 19,9%
duur: 2,7%
Menslike Ontwikkelingsindeks (HDI)
Statistiese saamgestelde indeks van lewensverwagting, opvoeding en per capita-inkomste.Sources: [Link] Kummu, M., Taka, M. & Guillaume, J. Gridded global datasets for Gross Domestic Product and Human Development Index over 1990–2015. Sci Data 5, 180004 (2018) doi:10.1038/sdata.2018.4
CO2-emissies Pasuruan, Jawa Timur
Koolstofdioksied (CO2) -uitlatings per capita per ton per jaar| Plek | CO2-emissies | CO2-emissies per capita | CO2-emissiesintensiteit |
|---|---|---|---|
| Pasuruan, Jawa Timur | 1 758 822 VSA-t. | 1,91 VSA-t. | 11 964 VSA-ton/km² |
| Jawa Timur | 73 482 011 VSA-t. | 1,92 VSA-t. | 1 538 VSA-ton/km² |
| Indonesië | 478 610 416 VSA-t. | 1,89 VSA-t. | 252,7 VSA-ton/km² |
CO2-emissies Pasuruan, Jawa Timur
| CO2-emissies (metrieke ton/jaar) 2013 | 1 758 822 VSA-t. |
| 2013 CO2-emissies (metrieke ton/jaar) per capita | 1,91 VSA-t. |
| 2013 CO2 uitlaat-intensiteit (tonnes/km²/year) | 11 964 VSA-ton/km² |
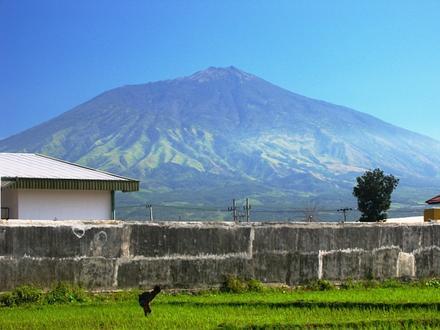
Natuurlike gevare risiko
Relatiewe risiko uit 10| grondverskuiwing | Hoog (8) |
| droogte | Medium (4) |
| vloed | Hoog (10) |
| Volcano | Hoog (10) |
| aardbewing | Medium (5,9) |
* Risiko's, veral met betrekking tot oorstromings of grondverskuiwings, is moontlik nie vir die hele gebied nie.
Sources: 1. Dilley, M., R.S. Chen, U. Deichmann, A.L. Lerner-Lam, M. Arnold, J. Agwe, P. Buys, O. Kjekstad, B. Lyon, and G. Yetman. 2005. Natural Disaster Hotspots: A Global Risk Analysis. Washington, D.C.: World Bank. https://doi.org/10.1596/0-8213-5930-4.
2. Center for Hazards and Risk Research - CHRR - Columbia University, Center for International Earth Science Information Network - CIESIN - Columbia University, and International Research Institute for Climate and Society - IRI - Columbia University. 2005. Global Drought Hazard Frequency and Distribution. Palisades, NY: NASA Socioeconomic Data and Applications Center (SEDAC). https://doi.org/10.7927/H4VX0DFT.
3. Center for Hazards and Risk Research - CHRR - Columbia University, Center for International Earth Science Information Network - CIESIN - Columbia University. 2005. Global Earthquake Hazard Distribution - Peak Ground Acceleration. Palisades, NY: NASA Socioeconomic Data and Applications Center (SEDAC). https://doi.org/10.7927/H4BZ63ZS.
4. Center for Hazards and Risk Research - CHRR - Columbia University, Center for International Earth Science Information Network - CIESIN - Columbia University. 2005. Global Volcano Hazard Frequency and Distribution. Palisades, NY: NASA Socioeconomic Data and Applications Center (SEDAC). https://doi.org/10.7927/H4BR8Q45.
5. Center for Hazards and Risk Research - CHRR - Columbia University, Center for International Earth Science Information Network - CIESIN - Columbia University. 2005. Global Flood Hazard Frequency and Distribution. Palisades, NY: NASA Socioeconomic Data and Applications Center (SEDAC). https://doi.org/10.7927/H4668B3D.
6. Center for Hazards and Risk Research - CHRR - Columbia University, Center for International Earth Science Information Network - CIESIN - Columbia University, and Norwegian Geotechnical Institute - NGI. 2005. Global Landslide Hazard Distribution. Palisades, NY: NASA Socioeconomic Data and Applications Center (SEDAC). https://doi.org/10.7927/H4P848VZ.
Onlangse aardbewings in die omgewing
Grootte 3.0 en groter| Datum | Tyd | grootte | Afstand | diepte | Plek | skakel |
|---|---|---|---|---|---|---|
| 2017-04-16 | 13:56 | 4,1 | 85,6 km | 233 610 m | 18km SSE of Babat, Indonesia | usgs.gov |
| 2017-04-08 | 01:17 | 3,9 | 61,4 km | 61 710 m | 0km ESE of Bureng, Indonesia | usgs.gov |
| 2016-10-16 | 10:45 | 4,4 | 68,8 km | 166 430 m | 9km NE of Jombang, Indonesia | usgs.gov |
| 2016-10-04 | 09:56 | 4,4 | 79,4 km | 169 150 m | 7km ENE of Karangbayat, Indonesia | usgs.gov |
| 2015-09-07 | 18:06 | 4 | 85,2 km | 31 020 m | 5km S of Pujiharjo, Indonesia | usgs.gov |
| 2015-02-28 | 07:19 | 4,1 | 28,8 km | 44 060 m | 28km NE of Pasuruan, Indonesia | usgs.gov |
| 2014-03-13 | 12:17 | 4,5 | 72,1 km | 184 190 m | 4km N of Ngoro, Indonesia | usgs.gov |
| 2011-10-05 | 11:26 | 4,7 | 69,6 km | 165 100 m | Java, Indonesia | usgs.gov |
| 2011-02-10 | 15:19 | 4,6 | 80,1 km | 153 200 m | Java, Indonesia | usgs.gov |
| 2008-11-05 | 09:11 | 3,8 | 84,5 km | 35 000 m | Java, Indonesia | usgs.gov |
Vind historiese aardbewings wat voorgekom het naby Pasuruan, Jawa Timur
Vroegste datum Laaste datum
Grootte 3.0 en groter Grootte 4.0 en groter Grootte 5.0 en groter

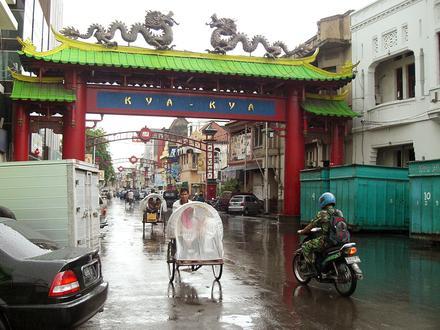
Pasuruan, Jawa Timur
Pasuruan (vroeër Pasoeroean) is 'n stad en lê in die provinsie Oos-Java in Indonesië. Die stad het vroeër ook die name: Passourouang, Passarouang, Passoeroeang, Passourawang, Passourouan, Pasoeroewan, Passouroang, Passourowang en Passourouangh. Pasuruan Wikipedia-bladsy
Poskodes
Persentasie besighede per Poskodes in Pasuruan Poskode 67156: 13%
Poskode 67153: 10,7%
Poskode 67155: 9,2%
Poskode 67154: 6%
Poskode 67162: 5,8%
Poskode 67157: 5,7%
Poskode 67161: 5%
Ander: 44,6%

Oor ons data
Die gegewens op hierdie bladsy word geskat met behulp van 'n aantal gereedskap en bronne wat in die openbaar beskikbaar is. Dit word voorsien sonder waarborg, en dit kan onakkuraathede bevat. Gebruik dit op eie risiko. Kyk hier vir meer inligting.