Kategorieë in Pitogo
VulstasieBoerderyKlerewinkelsGodsdiensKerkeRegeringskantoorBehuisingsontwikkelingLaerskoolOpvoedingOpvoedkundige instellingToeriste-aantreklikheidKoffiewinkelKruidenierswinkels en supermarkteRestauranteBankeDrukkeryBehuisingskompleksAlgemene handelaarGerieflikheidswinkelInkopiesPublieke parkeBehuisingsverenigingHotelle en motelleResort Hotel
Industries
Besigheidsverspreiding volgens bedryf in Pitogo
| Bedryfsbeskrywing | Aantal inrigtings |
|---|---|
| Opvoeding | 18 |
| Inkopies | 11 |
| Restaurante | 10 |
| Publieke administrasie | 8 |
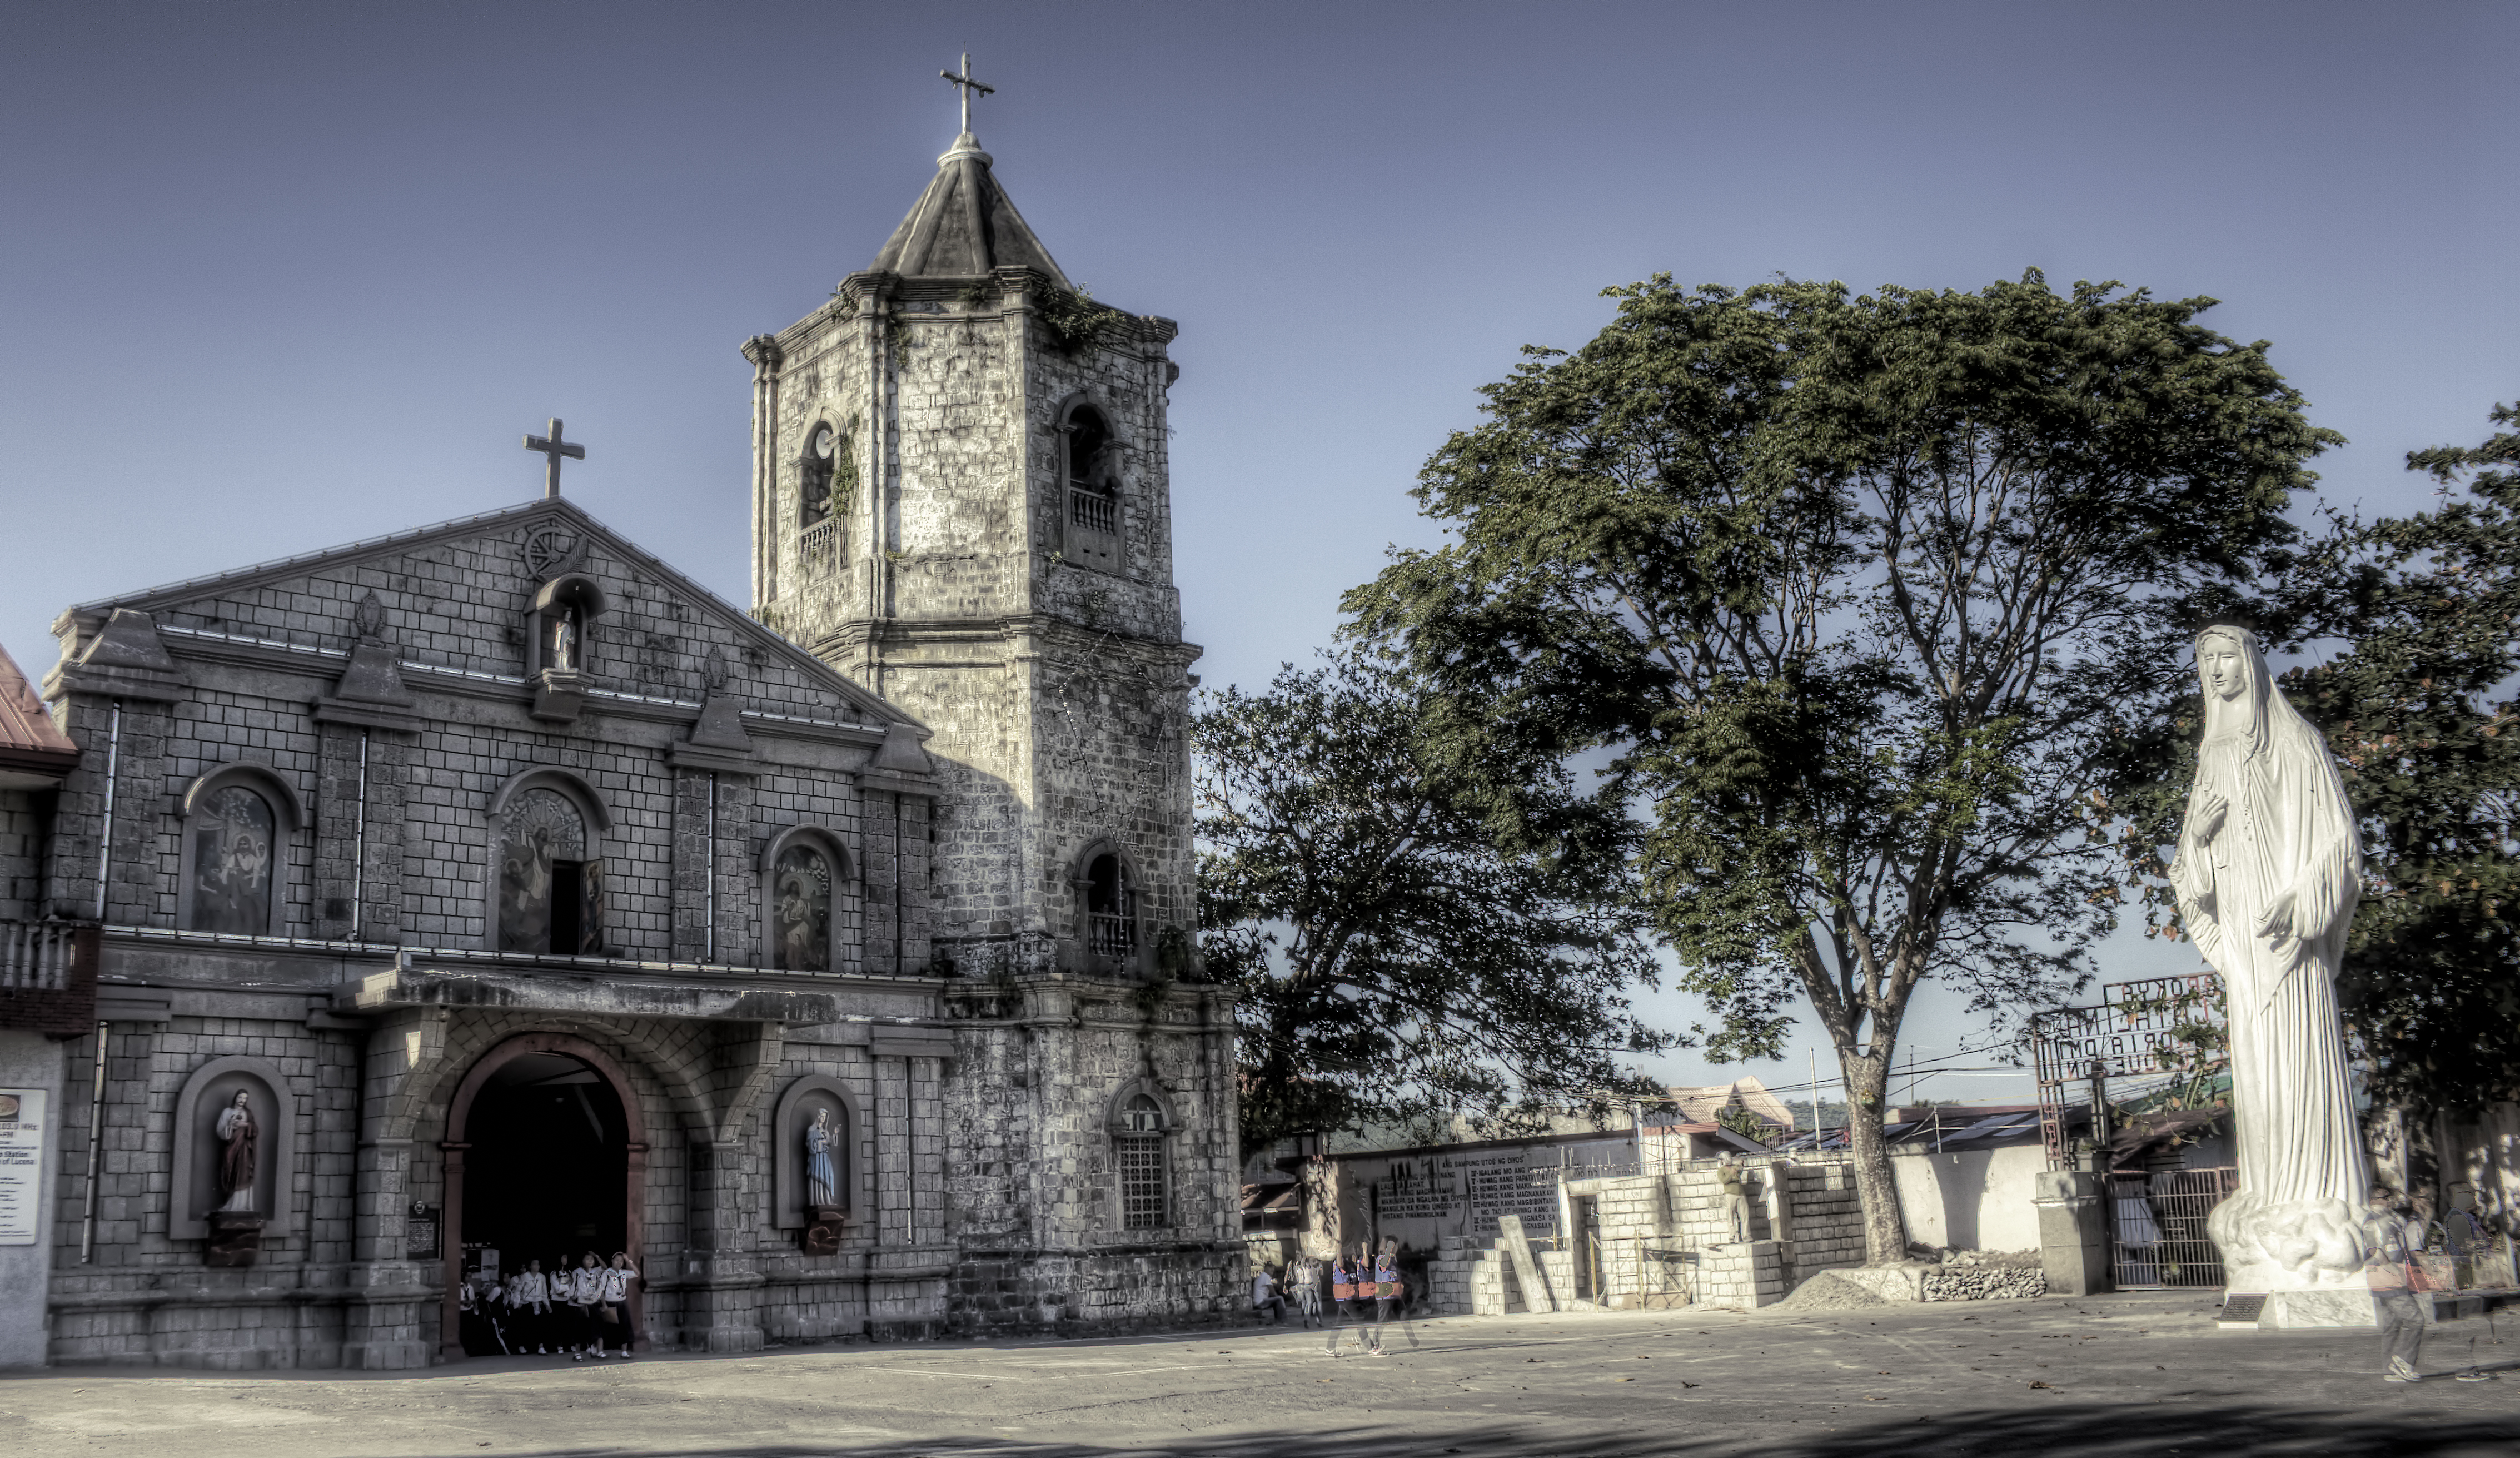
| Kerke | 7 |
| Inkopies Ander | 5 |
Pitogo feite
| gebied | 80.1 km² |
| Bevolking | 25 950 |
| Manlike bevolking | 13 426 (51.7%) |
| Vroulike bevolking | 12 524 (48.3%) |
| Bevolkingsverandering (1975 to 2020) | +284.6% |
| Bevolkingsverandering (2000 to 2020) | +26.8% |
| Gemiddelde ouderdom | 22.7 jaar (Manlik: 22.5, Vroulik: 23) |
| Lokaaltyd | |
| Tydsone | Filippynse standaardtyd |
| Lengte & Breedtegraad | 13.78380, 122.09020 |
| Poskodes | 4308 |
Kaart van Pitogo
Interaktiewe kaart
Pitogo bevolking
Jaar 1975 tot 2020
| Data | 1975 | 1990 | 2000 | 2015 | 2020 |
|---|---|---|---|---|---|
| Bevolking | 6 748 | 15 720 | 20 464 | 23 863 | 25 950 |
| Bevolkingsdigtheid | 84,3 / km² | 196,3 / km² | 255,6 / km² | 298,1 / km² | 324,1 / km² |
Bronne: JRC (European Commission's Joint Research Centre) werk aan die GHS built-up grid
Pitogo bevolkingsverandering van 2000 tot 2015
Toename van 16.6% van jaar 2000 tot 2015
| Plek | Verandering sedert 1975 | Verandering sedert 1990 | Verandering sedert 2000 |
|---|---|---|---|
| Pitogo | +253.6% | +51.8% | +16.6% |
| Filippyne | +146.5% | +63.3% | +29.5% |
Bronne: JRC (European Commission's Joint Research Centre) werk aan die GHS built-up grid
Pitogo mediaan ouderdom
Mediaan ouderdom: 22.7 jaar
| Plek | Gemiddelde ouderdom | Mediaan ouderdom (vroulik) | Mediaan ouderdom (manlik) |
|---|---|---|---|
| Pitogo | 22.7 yrs | 23 yrs | 22.5 yrs |
| Filippyne | 23.2 yrs | 23.6 yrs | 22.8 yrs |
Bronne: CIESIN (Center for International Earth Science Information Network)
Pitogo bevolkingsdigtheid
Bevolkingsdigtheid: 324 / km²
| Plek | Bevolking | gebied | Digtheid |
|---|---|---|---|
| Pitogo | 25 950 | 80,1 km² | 324 / km² |
| Filippyne | 96,6 million | 296 939,4 km² | 325 / km² |
Bronne: JRC (European Commission's Joint Research Centre) werk aan die GHS built-up grid
Pitogo historiese en geskatte bevolking
Geskatte bevolking van 1850 tot 2100
Bronne:
- JRC (European Commission's Joint Research Centre) werk aan die GHS built-up grid
- CIESIN (Center for International Earth Science Information Network)
- [skakel] Klein Goldewijk, K., Beusen, A., Doelman, J., and Stehfest, E.: Anthropogenic land use estimates for the Holocene – HYDE 3.2, Earth Syst. Sci. Data, 9, 927–953, https://doi.org/10.5194/essd-9-927-2017, 2017.
Area Kodes
Persentasie Areakodes wat deur besighede gebruik word in Pitogo
Menslike Ontwikkelingsindeks (HDI)
Statistiese saamgestelde indeks van lewensverwagting, opvoeding en per capita-inkomste.
Bron: [skakel] Kummu, M., Taka, M. &Guillaume, J. Roosterglobale datastelle vir Bruto Binnelandse Produk en Menslike Ontwikkelingsindeks oor 1990–2015. Sci Data 5, 180004 (2018) doi:10.1038/sdata.2018.4
Pitogo CO2-uitlatings
Koolstofdioksied (CO2) -uitlatings per capita per ton per jaar
| Plek | CO2-emissies | CO2-emissies per capita | CO2-emissiesintensiteit |
|---|---|---|---|
| Pitogo | 28,957 tn | 1.12 tn | 361.7 tons/km² |
| Filippyne | 104,920,564 tn | 1.09 tn | 353.3 tons/km² |
Bronne: [skakel] Moran, D., Kanemoto K; Jiborn, M., Wood, R., Többen, J., and Seto, K.C. (2018) Koolstofvoetspore van 13 000 stede. Environmental Research Letters DOI: 10.1088/1748-9326/aac72a
Pitogo CO2-uitlatings
| 2013 CO2-uitlatings (tonne/jaar) | 28,957 tn |
| 2013 CO2-uitlatings (tonne/jaar) per capita | 1.12 tn |
| 2013 CO2-uitlatings-intensiteit (tonne/km²/jaar) | 361.7 tons/km² |
Natuurlike gevare risiko
Relative risk out of 10
| Gevaar | Risk Level |
|---|---|
| Drought | Medium (4) |
| Flood | Medium (4) |
| Earthquake | High (8) |
| Cyclone | High (10) |
| Landslide | Medium (6) |
* Risk, particularly concerning flood or landslide, may not be for the entire area.
Bronne:
- Dilley, M., R.S. Chen, U. Deichmann, A.L. Lerner-Lam, M. Arnold, J. Agwe, P. Buys, O. Kjekstad, B. Lyon, and G. Yetman. 2005. Natural Disaster Hotspots: A Global Risk Analysis. Washington, D.C.: World Bank. https://doi.org/10.1596/0-8213-5930-4.
- Center for Hazards and Risk Research - CHRR - Columbia University, Center for International Earth Science Information Network - CIESIN - Columbia University, and Norwegian Geotechnical Institute - NGI. 2005. Global Landslide Hazard Distribution. Palisades, NY: NASA Socioeconomic Data and Applications Center (SEDAC). https://doi.org/10.7927/H4P848VZ.
- Center for Hazards and Risk Research - CHRR - Columbia University, Center for International Earth Science Information Network - CIESIN - Columbia University, International Bank for Reconstruction and Development - The World Bank, and United Nations Environment Programme Global Resource Information Database Geneva - UNEP/GRID-Geneva. 2005. Global Cyclone Hazard Frequency and Distribution. Palisades, NY: NASA Socioeconomic Data and Applications Center (SEDAC). https://doi.org/10.7927/H4CZ353K.
- Center for Hazards and Risk Research - CHRR - Columbia University, Center for International Earth Science Information Network - CIESIN - Columbia University, and International Research Institute for Climate and Society - IRI - Columbia University. 2005. Global Drought Hazard Frequency and Distribution. Palisades, NY: NASA Socioeconomic Data and Applications Center (SEDAC). https://doi.org/10.7927/H4VX0DFT.
- Center for Hazards and Risk Research - CHRR - Columbia University, Center for International Earth Science Information Network - CIESIN - Columbia University. 2005. Global Flood Hazard Frequency and Distribution. Palisades, NY: NASA Socioeconomic Data and Applications Center (SEDAC). https://doi.org/10.7927/H4668B3D.
- Center for Hazards and Risk Research - CHRR - Columbia University, Center for International Earth Science Information Network - CIESIN - Columbia University. 2005. Global Earthquake Hazard Distribution - Peak Ground Acceleration. Palisades, NY: NASA Socioeconomic Data and Applications Center (SEDAC). https://doi.org/10.7927/H4BZ63ZS.
Onlangse aardbewings in die omgewing
Grootte 3.0 en groter
| Datum▼ | Tyd↕ | Magnitude↕ | Distance↕ | diepte↕ | Plek↕ | skakel |
|---|---|---|---|---|---|---|
| 7/4/19 | 3:00 AM | 4.5 | 66.8 km | 10,000 m | 0km SSE of Montecillo, Philippines | usgs.gov |
| 2/6/19 | 6:01 AM | 4.6 | 28.1 km | 10,000 m | 5km S of Marao, Philippines | usgs.gov |
| 12/10/18 | 6:14 PM | 4.5 | 80.2 km | 35,000 m | 4km WSW of San Andres, Philippines | usgs.gov |
| 10/6/18 | 2:16 PM | 4.2 | 80.1 km | 42,750 m | 4km N of Bao, Philippines | usgs.gov |
| 7/16/18 | 10:09 AM | 4.3 | 66.8 km | 40,310 m | 29km NE of Perez, Philippines | usgs.gov |
| 7/5/18 | 9:00 PM | 4.4 | 67.4 km | 35,000 m | 21km NNE of Perez, Philippines | usgs.gov |
| 7/10/16 | 11:37 AM | 4.5 | 68.1 km | 40,430 m | 13km W of Bao, Philippines | usgs.gov |
| 6/22/16 | 2:27 AM | 4.3 | 5.1 km | 93,020 m | 5km ENE of Pitogo, Philippines | usgs.gov |
| 2/5/16 | 5:28 AM | 4.4 | 30.2 km | 10,000 m | 8km ESE of San Francisco, Philippines | usgs.gov |
| 2/5/16 | 5:00 AM | 5.3 | 26 km | 10,000 m | 3km ENE of San Francisco, Philippines | usgs.gov |

Oor ons data
Die data op hierdie bladsy word geskat met behulp van 'n aantal publiek beskikbare gereedskap en hulpbronne. Dit word verskaf sonder waarborg en kan onakkuraathede bevat. Gebruik op eie risiko.