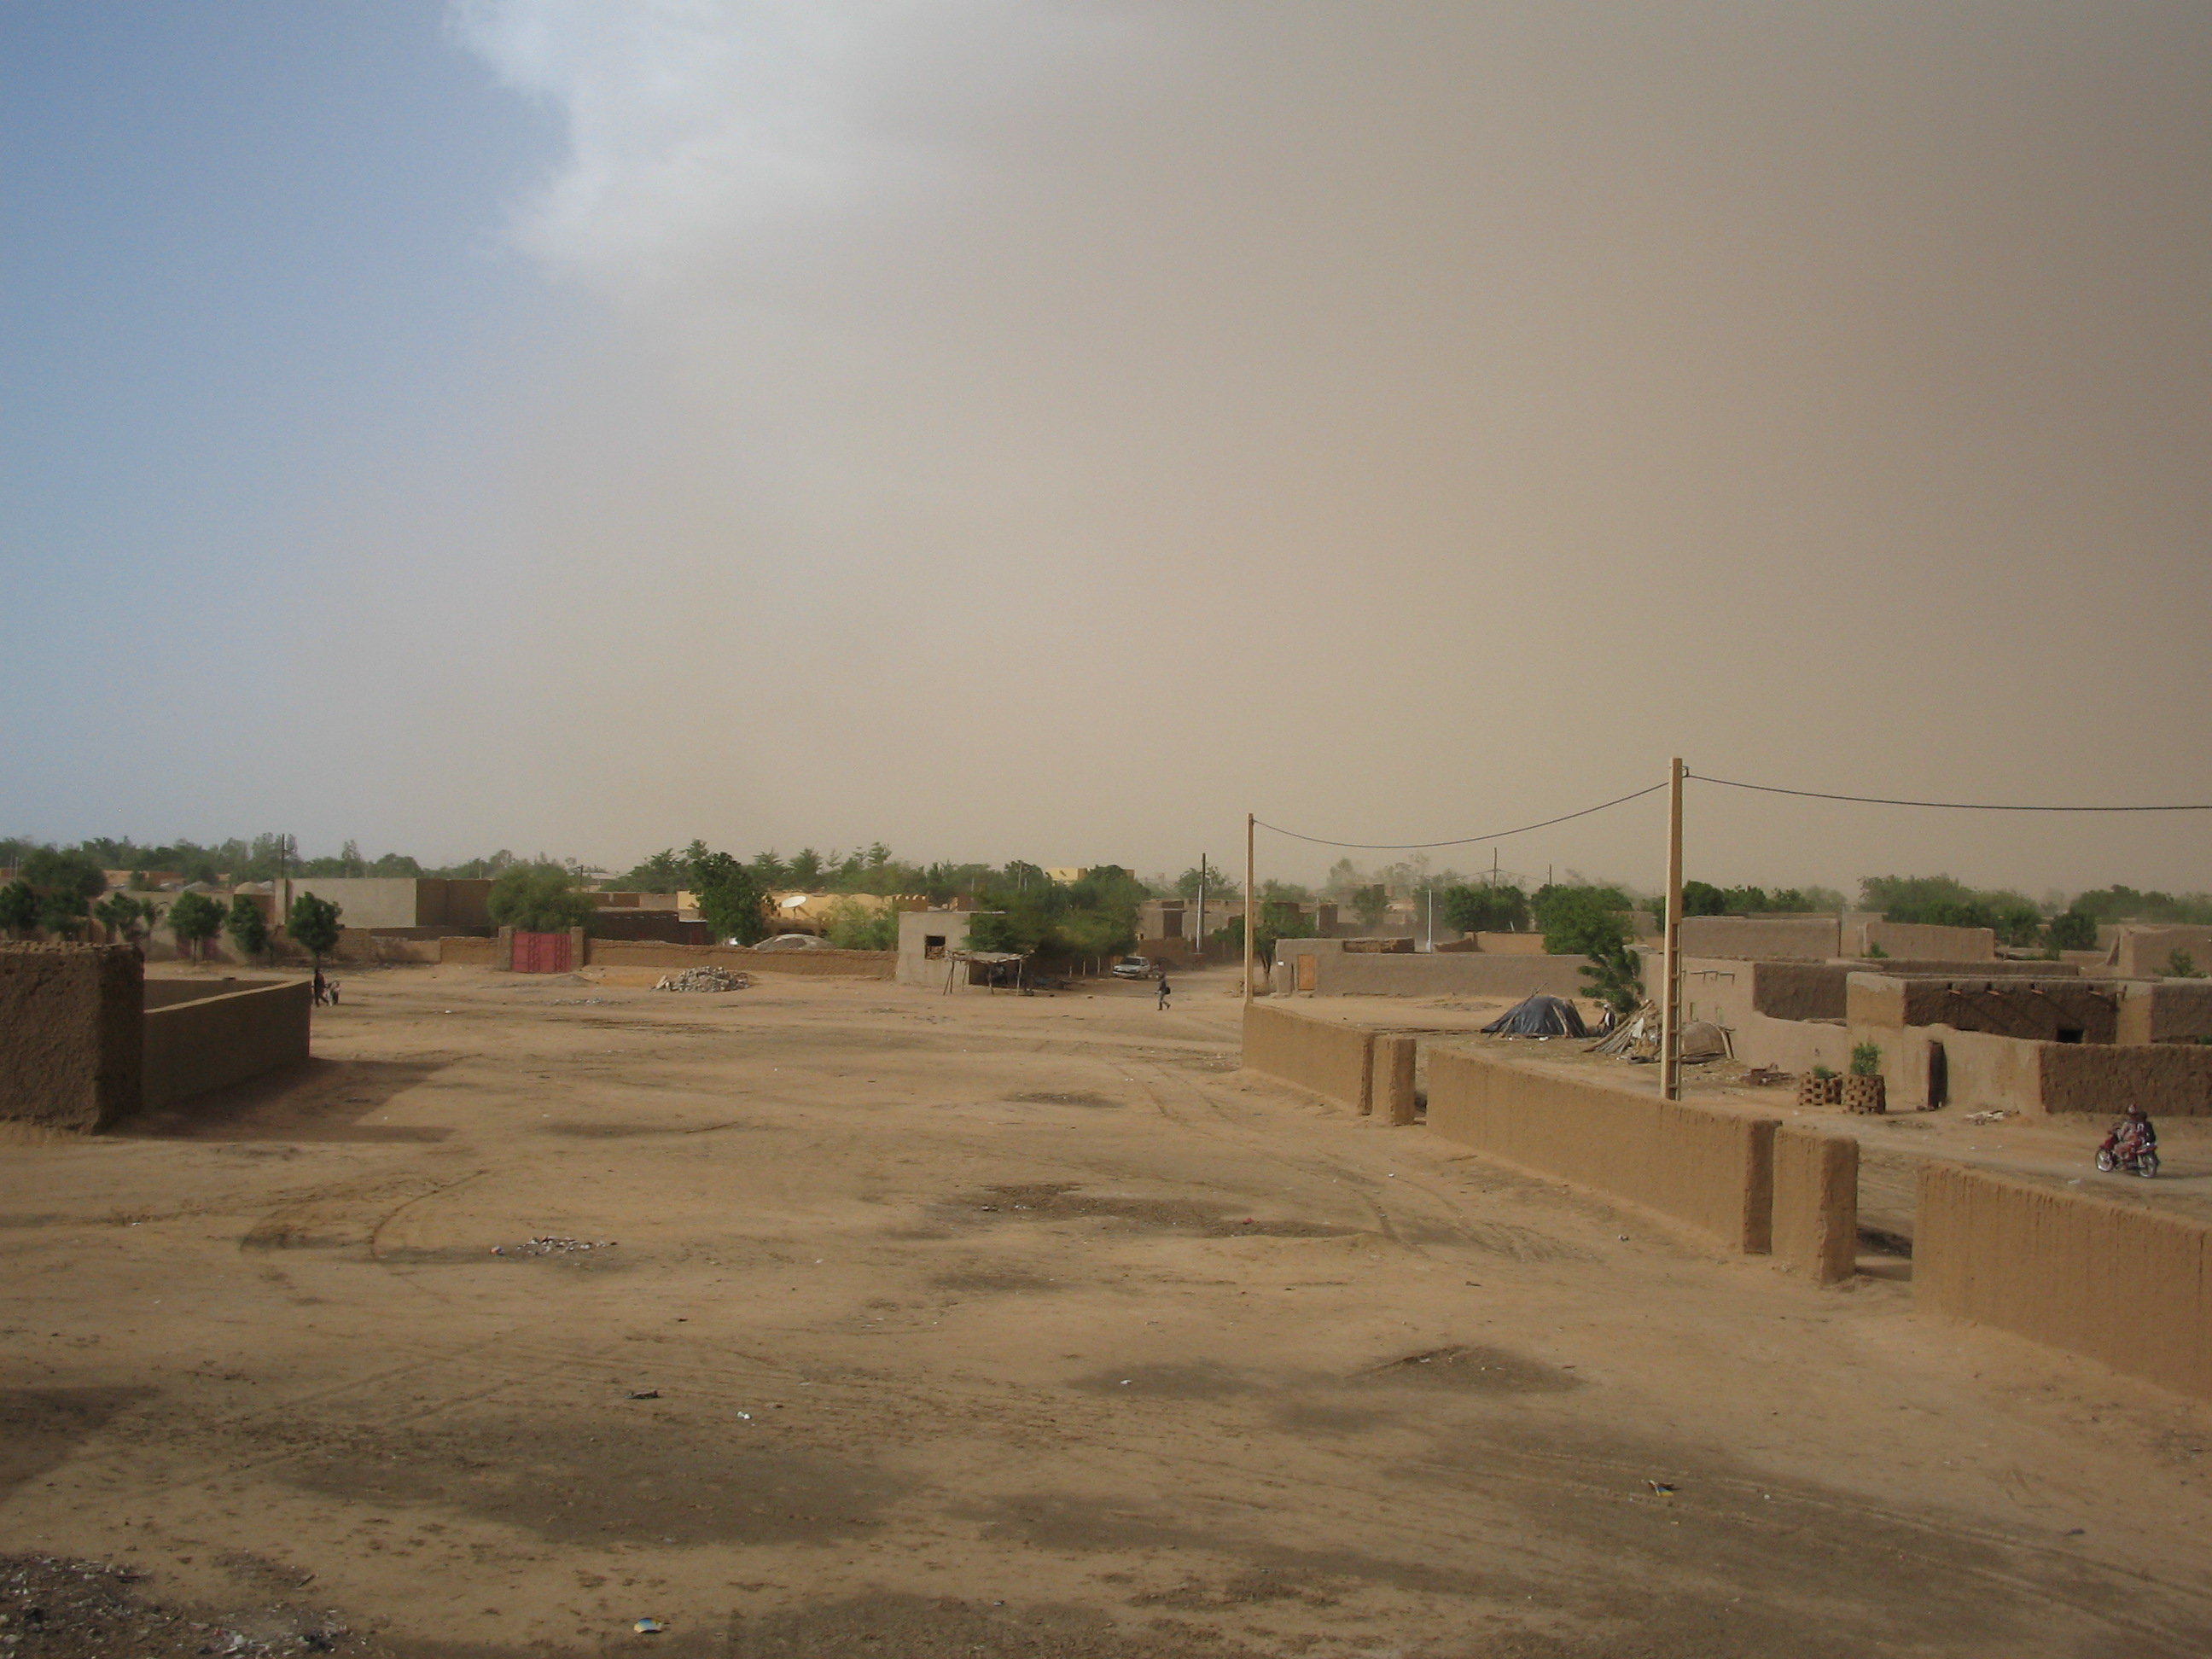
Ansongo feite
| gebied | 20572.6 km² |
| Bevolking | 201 690 |
| Manlike bevolking | 101 083 (50.1%) |
| Vroulike bevolking | 100 607 (49.9%) |
| Bevolkingsverandering (1975 to 2020) | +345.3% |
| Bevolkingsverandering (2000 to 2020) | +99.3% |
| Gemiddelde ouderdom | 16 jaar (Manlik: 15.2, Vroulik: 16.7) |
| Lokaaltyd | |
| Tydsone | Greenwich-tyd |
| Lengte & Breedtegraad | 15.65970, 0.50220 |
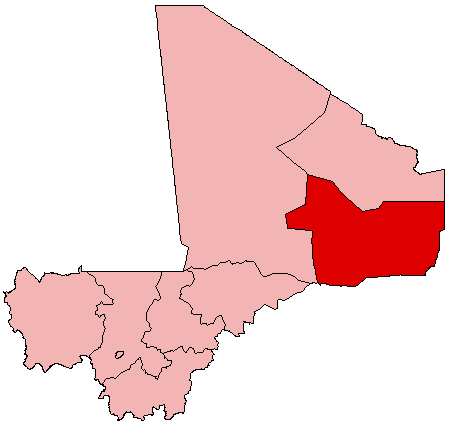
Kaart van Ansongo
Interaktiewe kaart
Ansongo bevolking
Jaar 1975 tot 2020
| Data | 1975 | 1990 | 2000 | 2015 | 2020 |
|---|---|---|---|---|---|
| Bevolking | 45 297 | 71 773 | 101 181 | 181 266 | 201 690 |
| Bevolkingsdigtheid | 2,2 / km² | 3,5 / km² | 4,9 / km² | 8,8 / km² | 9,8 / km² |
Bronne: JRC (European Commission's Joint Research Centre) werk aan die GHS built-up grid
Ansongo bevolkingsverandering van 2000 tot 2015
Toename van 79.2% van jaar 2000 tot 2015
| Plek | Verandering sedert 1975 | Verandering sedert 1990 | Verandering sedert 2000 |
|---|---|---|---|
| Ansongo | +300.2% | +152.6% | +79.2% |
| Gao Region | +254.6% | +139.3% | +73% |
| Mali | +173.2% | +108.4% | +59.6% |
Bronne: JRC (European Commission's Joint Research Centre) werk aan die GHS built-up grid
Ansongo mediaan ouderdom
Mediaan ouderdom: 16 jaar
| Plek | Gemiddelde ouderdom | Mediaan ouderdom (vroulik) | Mediaan ouderdom (manlik) |
|---|---|---|---|
| Ansongo | 16 yrs | 16.7 yrs | 15.2 yrs |
| Gao Region | 16 yrs | 16.7 yrs | 15.2 yrs |
| Mali | 16.1 yrs | 16.6 yrs | 15.5 yrs |
Bronne: CIESIN (Center for International Earth Science Information Network)
Ansongo bevolkingsdigtheid
Bevolkingsdigtheid: 9,8 / km²
| Plek | Bevolking | gebied | Digtheid |
|---|---|---|---|
| Ansongo | 201 690 | 20 572,6 km² | 9,8 / km² |
| Gao Region | 678 995 | 177 825,5 km² | 3,8 / km² |
| Mali | 17,7 million | 1 252 394 km² | 14,1 / km² |
Bronne: JRC (European Commission's Joint Research Centre) werk aan die GHS built-up grid
Ansongo historiese en geskatte bevolking
Geskatte bevolking van 1300 tot 2100
Bronne:
- JRC (European Commission's Joint Research Centre) werk aan die GHS built-up grid
- CIESIN (Center for International Earth Science Information Network)
- [skakel] Klein Goldewijk, K., Beusen, A., Doelman, J., and Stehfest, E.: Anthropogenic land use estimates for the Holocene – HYDE 3.2, Earth Syst. Sci. Data, 9, 927–953, https://doi.org/10.5194/essd-9-927-2017, 2017.
Area Kodes
Persentasie Areakodes wat deur besighede gebruik word in Ansongo
Menslike Ontwikkelingsindeks (HDI)
Statistiese saamgestelde indeks van lewensverwagting, opvoeding en per capita-inkomste.
Bron: [skakel] Kummu, M., Taka, M. &Guillaume, J. Roosterglobale datastelle vir Bruto Binnelandse Produk en Menslike Ontwikkelingsindeks oor 1990–2015. Sci Data 5, 180004 (2018) doi:10.1038/sdata.2018.4
Ansongo CO2-uitlatings
Koolstofdioksied (CO2) -uitlatings per capita per ton per jaar
| Plek | CO2-emissies | CO2-emissies per capita | CO2-emissiesintensiteit |
|---|---|---|---|
| Ansongo | 27,794 tn | 0.14 tn | 1.4 tons/km² |
| Gao Region | 93,515 tn | 0.14 tn | 0.5 tons/km² |
| Mali | 2,464,946 tn | 0.14 tn | 2 tons/km² |
Bronne: [skakel] Moran, D., Kanemoto K; Jiborn, M., Wood, R., Többen, J., and Seto, K.C. (2018) Koolstofvoetspore van 13 000 stede. Environmental Research Letters DOI: 10.1088/1748-9326/aac72a
Ansongo CO2-uitlatings
| 2013 CO2-uitlatings (tonne/jaar) | 27,794 tn |
| 2013 CO2-uitlatings (tonne/jaar) per capita | 0.14 tn |
| 2013 CO2-uitlatings-intensiteit (tonne/km²/jaar) | 1.4 tons/km² |
Natuurlike gevare risiko
Relatiewe risiko uit 10
| Gevaar | Risikovlak |
|---|---|
| droogte | Medium (5) |
| vloed | Medium (7) |
* Risiko's, veral met betrekking tot oorstromings of grondverskuiwings, is moontlik nie vir die hele gebied nie.
Bronne:
- Dilley, M., R.S. Chen, U. Deichmann, A.L. Lerner-Lam, M. Arnold, J. Agwe, P. Buys, O. Kjekstad, B. Lyon, and G. Yetman. 2005. Natural Disaster Hotspots: A Global Risk Analysis. Washington, D.C.: World Bank. https://doi.org/10.1596/0-8213-5930-4.
- Center for Hazards and Risk Research - CHRR - Columbia University, Center for International Earth Science Information Network - CIESIN - Columbia University, and International Research Institute for Climate and Society - IRI - Columbia University. 2005. Global Drought Hazard Frequency and Distribution. Palisades, NY: NASA Socioeconomic Data and Applications Center (SEDAC). https://doi.org/10.7927/H4VX0DFT.
- Center for Hazards and Risk Research - CHRR - Columbia University, Center for International Earth Science Information Network - CIESIN - Columbia University. 2005. Global Flood Hazard Frequency and Distribution. Palisades, NY: NASA Socioeconomic Data and Applications Center (SEDAC). https://doi.org/10.7927/H4668B3D.

Oor ons data
Die data op hierdie bladsy word geskat met behulp van 'n aantal publiek beskikbare gereedskap en hulpbronne. Dit word verskaf sonder waarborg en kan onakkuraathede bevat. Gebruik op eie risiko.