Kategorieë in Vauvert
Industries
Besigheidsverspreiding volgens bedryf in Vauvert
| Bedryfsbeskrywing | Aantal inrigtings | Gemiddelde ouderdom van besigheid |
|---|---|---|
| Kruidenierswinkels en supermarkte | 47 | — |
| Publieke administrasie | 37 | — |
| Korporatiewe bestuur | 37 | 21 year |
| Wynlandgoed | 35 | — |
| Eiendom | 34 | 21 year |
| Ander akkomodasie | 33 | — |
| Gesondheid en medies | 29 | — |
| Verpleërs | 28 | — |
| Skoonheidssalonne | 28 | — |
| Inkopies | 28 | — |
| Restaurante | 27 | 22 year |
| Motorwerktuigkundige | 27 | 23 year |
| Ander konstruksie | 27 | — |
| Inkopies Ander | 26 | — |
| Alle voedsels en dranke | 25 | 19 year |
| Haarkappers | 20 | — |
Vauvert feite
| gebied | 110.6 km² |
| Bevolking | 11 435 |
| Manlike bevolking | 5 499 (48.1%) |
| Vroulike bevolking | 5 936 (51.9%) |
| Bevolkingsverandering (1975 to 2020) | +30.5% |
| Bevolkingsverandering (2000 to 2020) | +10.5% |
| Gemiddelde ouderdom | 40.5 jaar (Manlik: 39.4, Vroulik: 41.5) |
| Lokaaltyd | |
| Tydsone | Sentraal-Europese somertyd |
| Lengte & Breedtegraad | 43.69529, 4.27705 |
| Poskodes | 30600 |
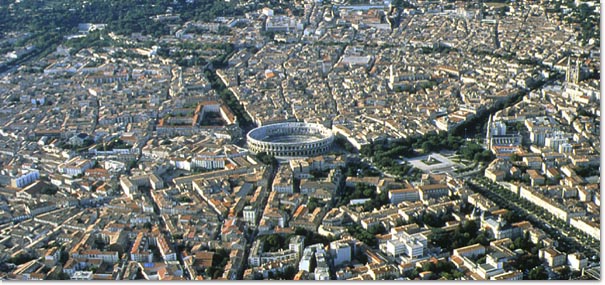
Kaart van Vauvert
Interaktiewe kaart
Vauvert bevolking
Jaar 1975 tot 2020
| Data | 1975 | 1990 | 2000 | 2015 | 2020 |
|---|---|---|---|---|---|
| Bevolking | 8 762 | 9 787 | 10 348 | 11 248 | 11 435 |
| Bevolkingsdigtheid | 79,2 / km² | 88,5 / km² | 93,5 / km² | 101,7 / km² | 103,4 / km² |
Vauvert bevolkingsverandering van 2000 tot 2015
Toename van 8.7% van jaar 2000 tot 2015
| Plek | Verandering sedert 1975 | Verandering sedert 1990 | Verandering sedert 2000 |
|---|---|---|---|
| Vauvert | +28.4% | +14.9% | +8.7% |
| Frankryk | +22.7% | +13.8% | +8.8% |
Vauvert mediaan ouderdom
Mediaan ouderdom: 40.5 jaar
| Plek | Gemiddelde ouderdom | Mediaan ouderdom (vroulik) | Mediaan ouderdom (manlik) |
|---|---|---|---|
| Vauvert | 40.5 yrs | 41.5 yrs | 39.4 yrs |
| Frankryk | 39.6 yrs | 41 yrs | 38.1 yrs |
Vauvert bevolkingsdigtheid
Bevolkingsdigtheid: 103 / km²
| Plek | Bevolking | gebied | Digtheid |
|---|---|---|---|
| Vauvert | 11 435 | 110,6 km² | 103 / km² |
| Frankryk | 65,9 million | 638 022,5 km² | 103 / km² |
Vauvert historiese en geskatte bevolking
Geskatte bevolking van 0 tot 2100
- JRC (European Commission's Joint Research Centre) werk aan die GHS built-up grid
- CIESIN (Center for International Earth Science Information Network)
- [skakel] Klein Goldewijk, K., Beusen, A., Doelman, J., and Stehfest, E.: Anthropogenic land use estimates for the Holocene – HYDE 3.2, Earth Syst. Sci. Data, 9, 927–953, https://doi.org/10.5194/essd-9-927-2017, 2017.
Area Kodes
Persentasie Areakodes wat deur besighede gebruik word in Vauvert
Prysverspreiding
Besigheidsverspreiding per prys vir Vauvert
Menslike Ontwikkelingsindeks (HDI)
Statistiese saamgestelde indeks van lewensverwagting, opvoeding en per capita-inkomste.
Vauvert CO2-uitlatings
Koolstofdioksied (CO2) -uitlatings per capita per ton per jaar
| Plek | CO2-emissies | CO2-emissies per capita | CO2-emissiesintensiteit |
|---|---|---|---|
| Vauvert | 84,818 tn | 7.42 tn | 766.7 tons/km² |
| Frankryk | 485,797,691 tn | 7.38 tn | 761.4 tons/km² |
| 2013 CO2-uitlatings (tonne/jaar) | 84,818 tn |
| 2013 CO2-uitlatings (tonne/jaar) per capita | 7.42 tn |
| 2013 CO2-uitlatings-intensiteit (tonne/km²/jaar) | 766.7 tons/km² |
Natuurlike gevare risiko
Relative risk out of 10
| Gevaar | Risk Level |
|---|---|
| Flood | High (10) |
| Earthquake | Low (2) |
* Risk, particularly concerning flood or landslide, may not be for the entire area.
- Dilley, M., R.S. Chen, U. Deichmann, A.L. Lerner-Lam, M. Arnold, J. Agwe, P. Buys, O. Kjekstad, B. Lyon, and G. Yetman. 2005. Natural Disaster Hotspots: A Global Risk Analysis. Washington, D.C.: World Bank. https://doi.org/10.1596/0-8213-5930-4.
- Center for Hazards and Risk Research - CHRR - Columbia University, Center for International Earth Science Information Network - CIESIN - Columbia University. 2005. Global Flood Hazard Frequency and Distribution. Palisades, NY: NASA Socioeconomic Data and Applications Center (SEDAC). https://doi.org/10.7927/H4668B3D.
- Center for Hazards and Risk Research - CHRR - Columbia University, Center for International Earth Science Information Network - CIESIN - Columbia University. 2005. Global Earthquake Hazard Distribution - Peak Ground Acceleration. Palisades, NY: NASA Socioeconomic Data and Applications Center (SEDAC). https://doi.org/10.7927/H4BZ63ZS.
Onlangse aardbewings in die omgewing
Grootte 3.0 en groter
| Datum▼ | Tyd↕ | Magnitude↕ | Distance↕ | diepte↕ | Plek↕ | skakel |
|---|---|---|---|---|---|---|
| 8/3/11 | 1:36 AM | 4.3 | 67.8 km | 4,000 m | France | usgs.gov |
| 8/8/06 | 5:18 AM | 3 | 56.6 km | 2,000 m | near the south coast of France | usgs.gov |
| 4/6/03 | 1:28 AM | 3.1 | 40.8 km | 3,000 m | near the south coast of France | usgs.gov |
| 5/15/99 | 4:08 AM | 3 | 94.9 km | 8,000 m | near the south coast of France | usgs.gov |
| 11/5/98 | 6:46 AM | 3.1 | 98.1 km | 1,000 m | near the south coast of France | usgs.gov |
| 11/2/98 | 5:32 PM | 3.1 | 74.6 km | 2,000 m | near the south coast of France | usgs.gov |
| 8/18/98 | 9:56 AM | 3.2 | 88.3 km | 2,000 m | near the south coast of France | usgs.gov |
| 5/27/98 | 10:18 PM | 3.3 | 98.8 km | 1,000 m | near the south coast of France | usgs.gov |
| 3/11/98 | 6:47 PM | 3 | 86.4 km | 5,000 m | near the south coast of France | usgs.gov |
| 2/9/98 | 2:16 PM | 3.2 | 67.3 km | 4,000 m | near the south coast of France | usgs.gov |

Oor ons data
Die data op hierdie bladsy word geskat met behulp van 'n aantal publiek beskikbare gereedskap en hulpbronne. Dit word verskaf sonder waarborg en kan onakkuraathede bevat. Gebruik op eie risiko.