Kategorieë in Freire
Industries
Besigheidsverspreiding volgens bedryf in Freire
| Bedryfsbeskrywing | Aantal inrigtings |
|---|---|
| Opvoeding | 31 |
| Inkopies | 25 |
| Kruidenierswinkels en supermarkte | 24 |
| Restaurante | 23 |
| Kerke | 13 |
| Korporatiewe bestuur | 12 |
| Ander akkomodasie | 10 |
| Publieke parke | 10 |
Freire feite
| gebied | 33.0 km² |
| Bevolking | 1 197 |
| Manlike bevolking | 612 (51.1%) |
| Vroulike bevolking | 585 (48.9%) |
| Bevolkingsverandering (1975 to 2020) | -49.6% |
| Bevolkingsverandering (2000 to 2020) | -34.7% |
| Gemiddelde ouderdom | 32.2 jaar (Manlik: 32.3, Vroulik: 32) |
| Lokaaltyd | |
| Tydsone | Chili-standaardtyd |
| Lengte & Breedtegraad | -38.95252, -72.62653 |
| Poskodes | 4940000 |
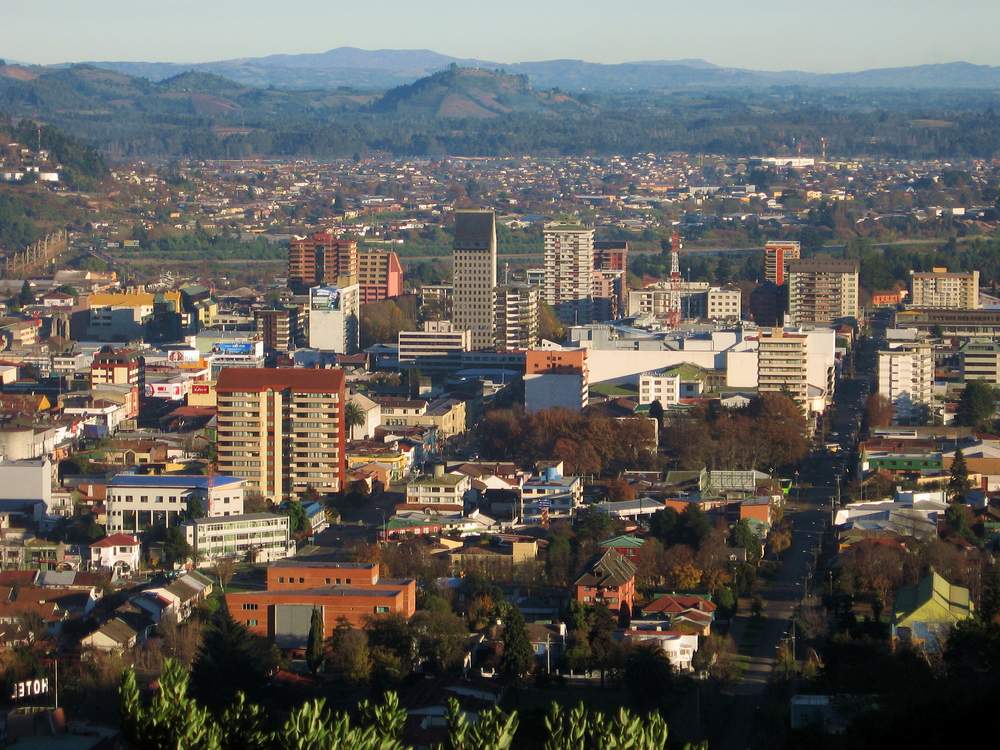
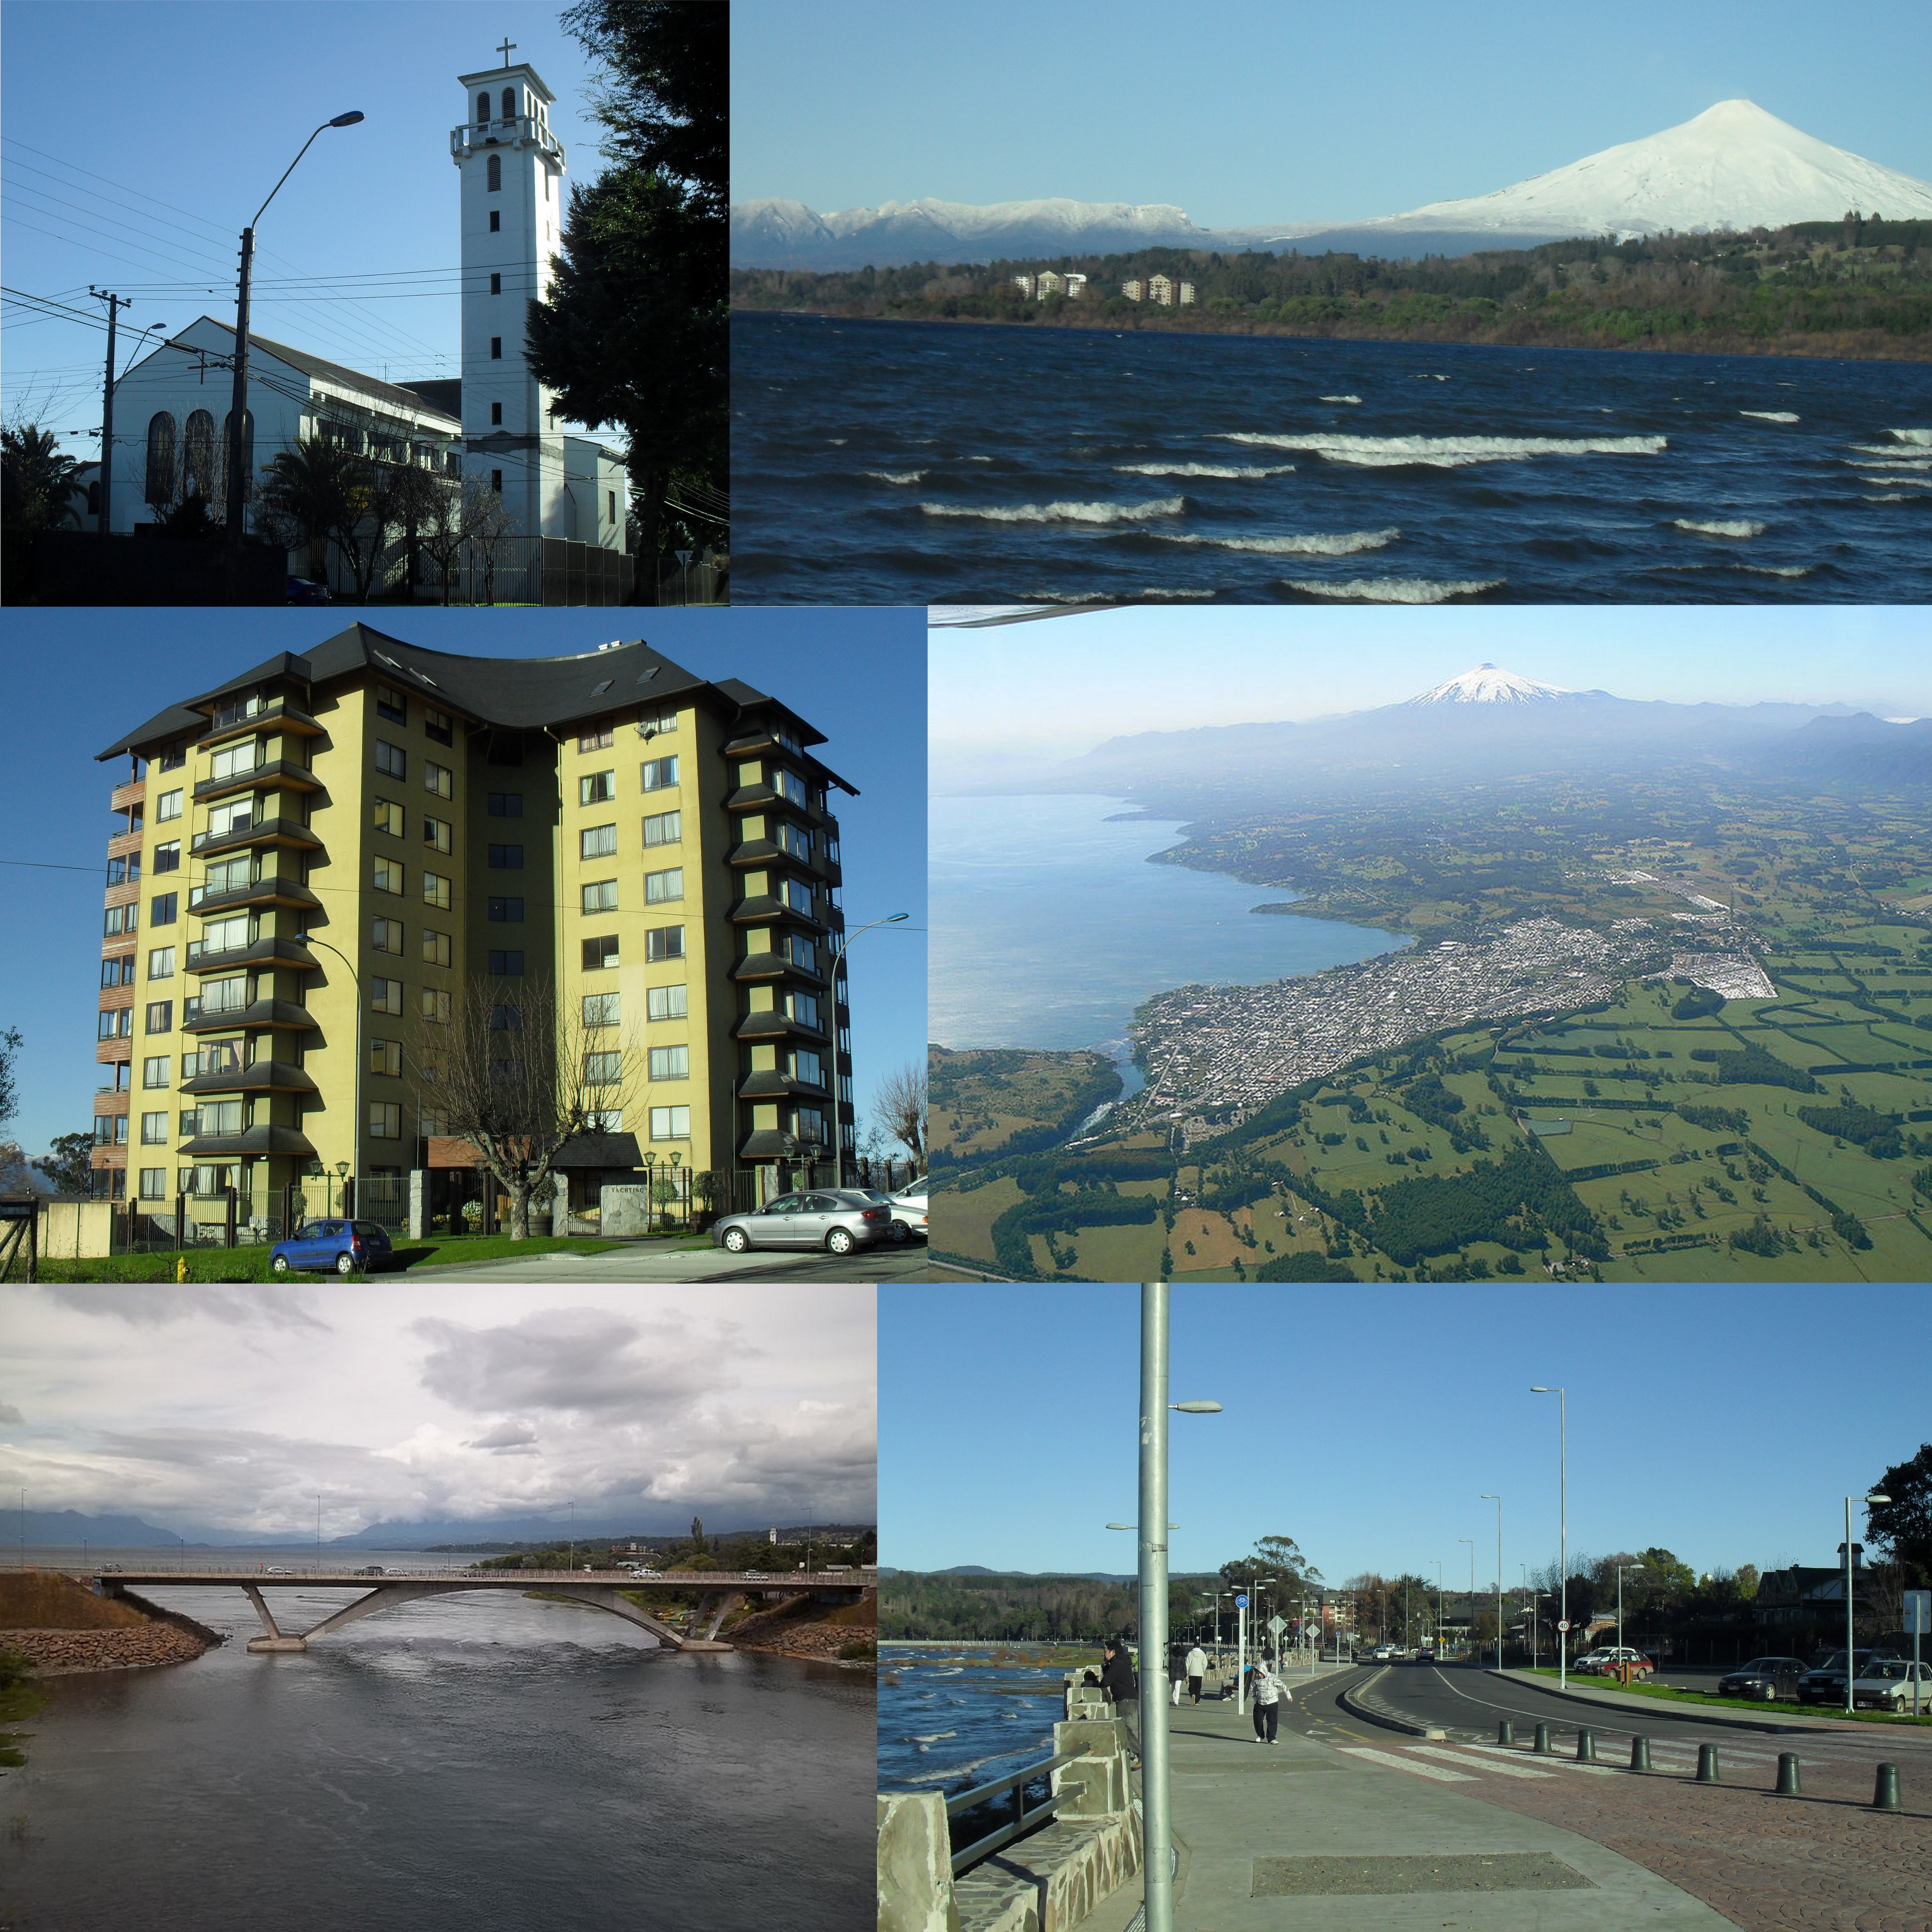
Kaart van Freire
Interaktiewe kaart
Freire bevolking
Jaar 1975 tot 2020
| Data | 1975 | 1990 | 2000 | 2015 | 2020 |
|---|---|---|---|---|---|
| Bevolking | 2 376 | 2 545 | 1 833 | 1 148 | 1 197 |
| Bevolkingsdigtheid | 72 / km² | 77,1 / km² | 55,5 / km² | 34,8 / km² | 36,3 / km² |
Freire bevolkingsverandering van 2000 tot 2015
Afname van 37.4% van jaar 2000 tot 2015
| Plek | Verandering sedert 1975 | Verandering sedert 1990 | Verandering sedert 2000 |
|---|---|---|---|
| Freire | -51.7% | -54.9% | -37.4% |
| Región de la Araucanía | +75.7% | +33.4% | +14.8% |
| Chili | +72.2% | +36.6% | +18.3% |
Freire mediaan ouderdom
Mediaan ouderdom: 32.2 jaar
| Plek | Gemiddelde ouderdom | Mediaan ouderdom (vroulik) | Mediaan ouderdom (manlik) |
|---|---|---|---|
| Freire | 32.2 yrs | 32 yrs | 32.3 yrs |
| Región de la Araucanía | 30.3 yrs | 31 yrs | 29.7 yrs |
| Chili | 31.3 yrs | 32 yrs | 30.6 yrs |
Freire bevolkingsdigtheid
Bevolkingsdigtheid: 36,3 / km²
| Plek | Bevolking | gebied | Digtheid |
|---|---|---|---|
| Freire | 1 197 | 33 km² | 36,3 / km² |
| Región de la Araucanía | 1 million | 31 793,4 km² | 31,5 / km² |
| Chili | 17,8 million | 751 744,8 km² | 23,7 / km² |
Freire historiese en geskatte bevolking
Geskatte bevolking van 0 tot 2100
- JRC (European Commission's Joint Research Centre) werk aan die GHS built-up grid
- CIESIN (Center for International Earth Science Information Network)
- [skakel] Klein Goldewijk, K., Beusen, A., Doelman, J., and Stehfest, E.: Anthropogenic land use estimates for the Holocene – HYDE 3.2, Earth Syst. Sci. Data, 9, 927–953, https://doi.org/10.5194/essd-9-927-2017, 2017.
Area Kodes
Persentasie Areakodes wat deur besighede gebruik word in Freire
Prysverspreiding
Besigheidsverspreiding per prys vir Freire
Menslike Ontwikkelingsindeks (HDI)
Statistiese saamgestelde indeks van lewensverwagting, opvoeding en per capita-inkomste.
Freire CO2-uitlatings
Koolstofdioksied (CO2) -uitlatings per capita per ton per jaar
| Plek | CO2-emissies | CO2-emissies per capita | CO2-emissiesintensiteit |
|---|---|---|---|
| Freire | 5,627 tn | 4.7 tn | 170.5 tons/km² |
| Región de la Araucanía | 4,403,719 tn | 4.39 tn | 138.5 tons/km² |
| Chili | 87,296,657 tn | 4.91 tn | 116.1 tons/km² |
| 2013 CO2-uitlatings (tonne/jaar) | 5,627 tn |
| 2013 CO2-uitlatings (tonne/jaar) per capita | 4.7 tn |
| 2013 CO2-uitlatings-intensiteit (tonne/km²/jaar) | 170.5 tons/km² |
Natuurlike gevare risiko
Relatiewe risiko uit 10
| Gevaar | Risikovlak |
|---|---|
| droogte | Hoog (8) |
| vloed | Medium (7) |
| aardbewing | Medium (7) |
| grondverskuiwing | Medium (7) |
* Risiko's, veral met betrekking tot oorstromings of grondverskuiwings, is moontlik nie vir die hele gebied nie.
- Dilley, M., R.S. Chen, U. Deichmann, A.L. Lerner-Lam, M. Arnold, J. Agwe, P. Buys, O. Kjekstad, B. Lyon, and G. Yetman. 2005. Natural Disaster Hotspots: A Global Risk Analysis. Washington, D.C.: World Bank. https://doi.org/10.1596/0-8213-5930-4.
- Center for Hazards and Risk Research - CHRR - Columbia University, Center for International Earth Science Information Network - CIESIN - Columbia University, and Norwegian Geotechnical Institute - NGI. 2005. Global Landslide Hazard Distribution. Palisades, NY: NASA Socioeconomic Data and Applications Center (SEDAC). https://doi.org/10.7927/H4P848VZ.
- Center for Hazards and Risk Research - CHRR - Columbia University, Center for International Earth Science Information Network - CIESIN - Columbia University, and International Research Institute for Climate and Society - IRI - Columbia University. 2005. Global Drought Hazard Frequency and Distribution. Palisades, NY: NASA Socioeconomic Data and Applications Center (SEDAC). https://doi.org/10.7927/H4VX0DFT.
- Center for Hazards and Risk Research - CHRR - Columbia University, Center for International Earth Science Information Network - CIESIN - Columbia University. 2005. Global Flood Hazard Frequency and Distribution. Palisades, NY: NASA Socioeconomic Data and Applications Center (SEDAC). https://doi.org/10.7927/H4668B3D.
- Center for Hazards and Risk Research - CHRR - Columbia University, Center for International Earth Science Information Network - CIESIN - Columbia University. 2005. Global Earthquake Hazard Distribution - Peak Ground Acceleration. Palisades, NY: NASA Socioeconomic Data and Applications Center (SEDAC). https://doi.org/10.7927/H4BZ63ZS.
Onlangse aardbewings in die omgewing
Grootte 3.0 en groter
| Datum▼ | Tyd↕ | Magnitude↕ | Distance↕ | diepte↕ | Plek↕ | skakel |
|---|---|---|---|---|---|---|
| 6/24/19 | 4:42 AM | 4.5 | 74.1 km | 26,460 m | 19km WNW of Carahue, Chile | usgs.gov |
| 6/8/19 | 1:44 PM | 4.7 | 49.3 km | 89,330 m | 11km WSW of Villarrica, Chile | usgs.gov |
| 5/22/19 | 10:42 PM | 4.3 | 69.4 km | 81,070 m | 21km SSE of Victoria, Chile | usgs.gov |
| 3/25/19 | 4:32 PM | 4.1 | 62.2 km | 95,920 m | 19km SE of Loncoche, Chile | usgs.gov |
| 9/19/18 | 11:28 AM | 4.1 | 91.5 km | 60,840 m | 20km ENE of Las Animas, Chile | usgs.gov |
| 7/31/18 | 12:46 PM | 4.5 | 79.6 km | 67,620 m | 4km WNW of Traiguen, Chile | usgs.gov |
| 1/25/18 | 4:03 AM | 4.4 | 93 km | 67,340 m | 14km NW of Victoria, Chile | usgs.gov |
| 7/3/17 | 4:45 PM | 4.3 | 77.7 km | 12,120 m | 49km SW of Carahue, Chile | usgs.gov |
| 6/23/17 | 10:00 AM | 5 | 85.8 km | 115,450 m | 17km SE of Pucon, Chile | usgs.gov |
| 5/20/17 | 2:13 PM | 4 | 64.9 km | 10,000 m | 34km SSW of Carahue, Chile | usgs.gov |

Oor ons data
Die data op hierdie bladsy word geskat met behulp van 'n aantal publiek beskikbare gereedskap en hulpbronne. Dit word verskaf sonder waarborg en kan onakkuraathede bevat. Gebruik op eie risiko.